Teacher Education Summary Data 2018-2019
2018-2019 Annual Reporting Measures
This data represents the 2017-2018 academic year. This data represents responses from all undergraduate programs at MSUM.
The graphics below represent data from three Common Metrics Surveys: Exit Survey, Transition to Teaching Survey, and Supervisor Survey. The first two graphics below represent aggregate data from the fourteen NExT institutions. The second two graphics represent MSUM specific data. Data illustrates mean scores on the scales contained within each survey. Averages are based on a 4.0 likert-type scale. Additional information related to each scale is provided below the graphics.
MSUM 2017-2018 Response Rates:
- Transition to Teaching Survey = 18%
- Supervisor Survey = 64% of available supervisors
- Exit Survey = 53%
Aggregate 2018 NExT Survey
Scale Score: Average

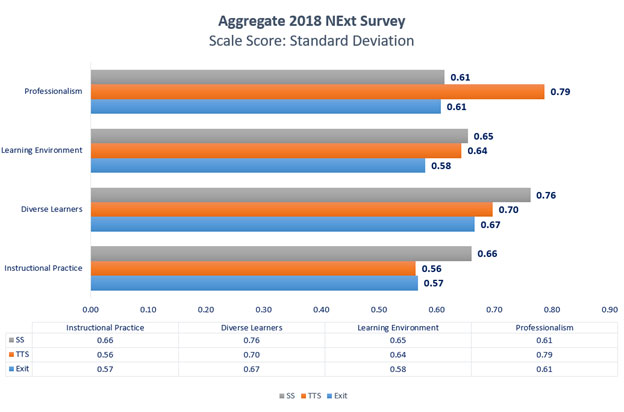
Aggregate 2018 NExT Survey
Scale Score: Standard Deviation
Minnesota State University Moorhead 2018 NExT Survey
Scale Score: Averages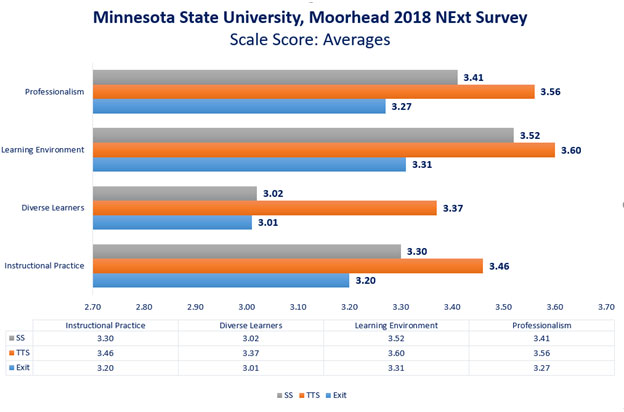
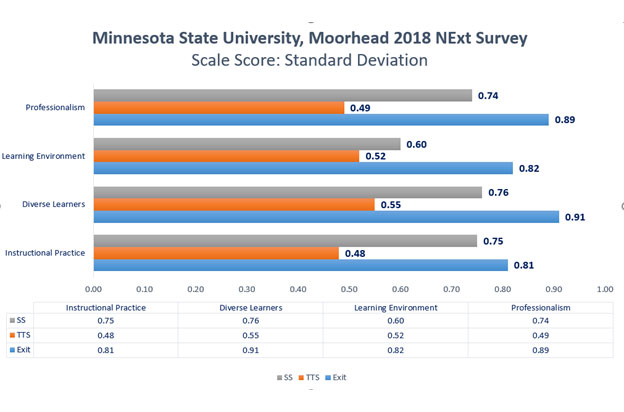
Minnesota State University Moorhead 2018 NExT Survey
Scale Score: Standard Deviation
Professionalism: 95% of 2017-2018 graduates, 97% of first-year teachers, and 93% of supervisors agree/tend to agree MSUM graduates are prepared to continue developing as a teacher through using colleague feedback.
Learning Environment: 95% of 2017-2018 graduates, 97% of first year teachers, and 93% of supervisors agree/tend to agree MSUM graduates are prepared to create a learning environment in which differences are respected.
Diverse Learners: 94% of first year teachers and 93% of supervisors agree/tend to agree MSUM graduates are able to differentiate instruction for different learners or for different developmental needs, respectively.
Instructional Practice: 91% of 2017-2018 graduates, 97% of first year teachers, and 96% of supervisors agree/tend to agree graduates are prepared to and are able to effectively teach their subject matter.
Additionally, 93% of supervisors agree/tend to agree first year teachers from MSUM promote student engagement in their classrooms and 97% of first-year teachers agree/tend to agree MSUM prepared them to be successful teaching and they would recommend MSUM to a prospective teacher!
MTLE Passing Rates (Pedagogy)
- Early Childhood (n = 24)
- Subtest 1 = 100%
- Subtest 2 = 100%
- Elementary (n = 113)
- Subtest 1 = 97%
- Subtest 2 = 96%
- Secondary (n = 86)
- Subtest 1 = 100%
- Subtest 2 = 100%
Content area passing rates range from 71% to 100%. Specific passing rates are not publicly reported due to low n’s in several content areas.
Other Completer Data
- Average time to complete: 3.4 years (40.3 months)
- Average GPA: 3.49
- Educational Leadership Licenses Granted: 80 licenses granted as follows:
- 44 Principal
- 13 Special Ed Director
- 10 Superintendent
- 13 Community Education Director
- University-wide student loan default rate: updated cohort data not available at time of reporting