Teacher Education Summary Data 2020-2021
2020-2021 Annual Reporting Measures
Measure 1: Impact on P-12 Learning and Development (Component 4.1)
NExT Teacher Effectiveness Research
Providers must evidence that program completers have skills to positively impact P-12 student learning and those completers apply skills demonstrating teaching effectiveness. Institutions within states such as MN that do not have robust state data must develop valid and reliable ways to demonstrate completer effectiveness. The Network for Excellence in Teaching (NExT) Student Work-Sampling Interview Protocol and Student Impact Rubric are two promising resources to assist teacher preparation providers in meeting CAEP requirements and provide an additional source of data to triangulate with the NExT Supervisor Survey and Transition to Teaching Survey.
To complete this NExT grant funded pilot project, novice teachers teaching in early childhood, elementary, content areas (e.g., social studies, math) and specialty areas (e.g., physical education, music) participated in work sampling interviews and were prompted to think about their classroom context, cultural relevance of learning goals and related learning activities. Additionally, interview questions focused upon analyzing work samples to determine levels of learning and next steps for learning in relation to identified patterns of learning.
Interviews were conducted over the course of four semesters: Spring 2019, Fall 2019, Spring 2020 and Fall 2020. Data summarized below indicates that MSUM graduates are able to positively impact student learning by planning assessments, analyzing assessments to determine student learning, providing feedback to prompt further student learning and using their analysis to inform their teaching.
NExT Teacher Effectiveness Project Disaggregated Means*
Means are based on a four-point scale with three being the performance level of high performing beginning teachers.
| Rubric 1: Planning Assessments Rating Mean | Rubric 2: Analysis of Student Learning Rating Mean | Rubric 3.1: Feedback on Student Learning Rating Mean | Rubric 3.2: Feedback on Student Learning Rating Mean | Rubric 4: Uses Analysis of Student Learning to Inform Teaching Rating Mean | |
|---|---|---|---|---|---|
| Overall |
Rubric 1: Planning Assessments Rating Mean
2.72 |
Rubric 2: Analysis of Student Learning Rating Mean
2.79 |
Rubric 3.1: Feedback on Student Learning Rating Mean
2.24 |
Rubric 3.2: Feedback on Student Learning Rating Mean
2.29 |
Rubric 4: Uses Analysis of Student Learning to Inform Teaching Rating Mean
2.24 |
| Secondary/K-12 teachers (n = 10) |
Rubric 1: Planning Assessments Rating Mean
2.55 |
Rubric 2: Analysis of Student Learning Rating Mean
2.65 |
Rubric 3.1: Feedback on Student Learning Rating Mean
2.05 |
Rubric 3.2: Feedback on Student Learning Rating Mean
2.05 |
Rubric 4: Uses Analysis of Student Learning to Inform Teaching Rating Mean
2.00 |
| Elementary/Early childhood teachers (n = 19) |
Rubric 1: Planning Assessments Rating Mean
2.82 |
Rubric 2: Analysis of Student Learning Rating Mean
2.87 |
Rubric 3.1: Feedback on Student Learning Rating Mean
2.34 |
Rubric 3.2: Feedback on Student Learning Rating Mean
2.26 |
Rubric 4: Uses Analysis of Student Learning to Inform Teaching Rating Mean
2.37 |
*Rubric 1 is aligned to edTPA Task 1 Rubric 5; Rubric 2 is aligned to edTPA Task 3, Rubric 11; Rubrics 3.1 and 3.2 are aligned with edTPA Rubrics 12 and 13 and Rubric 4 is aligned with edTPA Task 3, Rubric 15. Means are based on a four-point scale with three being the performance level of high performing beginning teachers.
Rubric 2 indicates the strongest performance area for this sample of MSUM graduates. This demonstrates candidates’ abilities to identify patterns of learning across individuals and groups of students. Along with skills in providing feedback to students, this provides evidence of candidates’ abilities to positively impact P-12 learners.
Measure 2: Indicators of Teaching Effectiveness (Component 4.2)
NExT Teacher Effectiveness Research
The NExT Teacher Effectiveness Research project also allowed the provider to analyze teaching practices of the beginning teachers and helped to identify high-level performance indicators (e.g., learning goals set high expectations for students).
| Example Rubric Indicators | Example Themes from Interviews | |
|---|---|---|
| High-level performance | Assets focused Learning goals set high expectations Nuanced interpretations of student performance Interpretation of learning is tightly linked to knowledge about students |
Expressed multiple ways to assess multiple goals Articulated clear targets with clear plans Knew standards, and aligned research-based strategies; Knew how to link instructional strategies in planning process; Understood curriculum and the learner Made clear data-based/informed decisions Addressed social-emotional learning/whole child Demonstrated spiral thinking; Promoted metacognition Utilized supports (mentoring, collaboration, specialists) |
Summary of number of teachers by year of teaching falling within high, middle, or low performance category based on rubric indicators.
| 1st year n = 12 | 2nd year n = 10 | 3rd year n = 7 | Total | |
|---|---|---|---|---|
| High | 2 | 5 | 5 | 12 |
| Middle | 7 | 3 | 2 | 12 |
| Low* | 3 | 2 | 0 | 5 |
*Low performance is not an evaluative measure. The low performance indicator is simply within the context of the rubric and the interview data.
Measure 3: Satisfaction of Employers and Employment Milestones (Components 4.3 | A.4.1)
Satisfaction of employers is evidenced from quantitative responses and qualitative comments provided on the NExT Common Metrics Supervisor Survey (SS). This data represents the 2019-2020 academic year. Survey data represents responses from all undergraduate programs at MSUM.
MSUM 2019-2020 Response Rate:
Supervisor Survey (SS) = 65.9% of reachable supervisors
Each NExT Common Metrics survey is designed to collect information related to four constructs: Professionalism, Learning Environment, Diverse Learners, and Instructional Practice. The below summaries provide information related to each construct. Data indicates consistency across annual reporting years.
Means are based on a four-point scale.
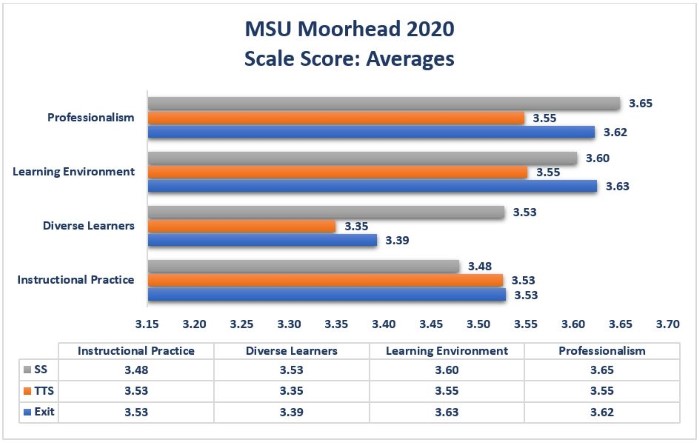

Professionalism (SS): Consistently, supervisors of MSUM graduates indicate candidates demonstrate positive skills within this area. Detailed item analysis suggests that supervisors of MSUM completers perceive that MSUM completers have skills in acting as advocates for all students (2020 MSUM item M = 3.62 vs. 2020 NExT item M = 3.75) and collaborating with parents and guardians to support student learning (2020 MSUM item M = 3.52 vs. 2020 NExT item M = 3.63). Although compared to NExT benchmarking data these skills could be further developed, the means on a four-point scale indicate strong employer satisfaction in this area.
Learning Environment (SS): Skills within the Learning Environment scale appear to be an area of strength for MSUM completers as compared to aggregated data from NExT institutions. Clearly communicating expectations for appropriate student behavior (M = 3.55) and helping students regulate their own behavior (M = 3.38) are the two items within MSUM’s 2020 data having the lowest means in this scale, indicating that supervisors perceive MSUM graduates have strong skills related to learning environments.
Diverse Learners (SS): Generally speaking, data indicates that item means within this scale are trending upward across the three most recent data cycles. However, two items show a decrease in means over time: 1) Effectively teaches students from culturally and ethnically diverse backgrounds and communities (2018 M = 3.64, 2019 M = 3.63, and 2020 M = 3.52) and 2) differentiates instructions for students with IEPs and 504s (2018 M = 3.57, 2019 M = 3.66, and 2020 M = 3.55). Yet, based on a 4-point scale these means are still exceptionally strong.
Instructional Practice (SS): Two items within Instructional Practice supervisors indicate as areas of strength are 1) effectively teaching the subject matter in the licensure area (M = 3.66) and 2) selecting instructional strategies to align with curriculum standards (M = 3.69).
Example qualitative comments include:
She [MSUM graduate] works to build great relationships first and foremost…She then looks to connect with families and showcase what students are doing… She also worked great with the adults in our building as well. Great asset to our [school] family!
[MSUM graduate] is a great addition to the [high school] staff. We are lucky to have her!
[MSUM graduate] is a hard-working, dedicated, and compassionate teacher. We are lucky to have her!
[MSUM graduate] was an exemplary first year teacher, she has a promising career ahead of her.
[MSUM graduate] did a wonderful job in her first year of teaching…[she] had wonderful classroom control and her students were very aware of and willing to follow the expectation that she set forth. Her calm demeanor in the classroom made it a great learning environment for her students. [She] and her partner teacher did a fantastic job of collaborating throughout the year. As two new teachers, they built off each other’s strengths and neither weren't afraid to reach out when they had questions on various issues. Finally, [she] was very impressive in her ability to move from face to face teaching to an online classroom. She taught live lessons, kept up with the students that needed help, sought advice when it was necessary and submitted all reports and documents on time.
[MSUM graduate] has done a great job! I am pleased with her performance and so very glad she joined the [elementary] school community!
[MSUM graduate] is a joy to be around. She is passionate and approaches each day with zeal. Her resilience is unmatched. I have worked with some very good [special education] teachers and she has taught me some new things already in her first year. We are thrilled to have [MSUM graduate] on our team.
His [MSUM graduate] colleagues love working with him and the students respond well to him. He managed his first year like a champ! We are grateful to work with [MSUM graduate]!
Measure 4: Satisfaction of Completers (Components 4.4 | A.4.2)
Satisfaction of completers is evidenced from responses provided on the NExT Common Metrics Transition to Teaching Survey (TTS). This data represents the 2019-2020 academic year. Survey data represents responses from all undergraduate programs at MSUM.
MSUM 2019-2020 Response Rate:
Transition to Teaching Survey (TTS) = 43.5% of reachable graduates
According to the Transition to Teaching Survey (2020), 98% of first year teachers tended to agree or agree that they would recommend MSUM to a prospective teacher.
Additionally, 98% of the same first year teachers, tended to agree or agree that MSUM prepared them to be a successful teacher.
Further data provides specific details regarding completer satisfaction:
Professionalism (TTS): Consistently, first year teachers indicate they perceive themselves as well-prepared in this area. Detailed item analysis suggests that first year teachers feel prepared to act as an advocate for all students (2020 MSUM item M = 3.81, 2020 secondary/k-12 item M = 3.88 and 2020 elementary/early childhood M = 3.73). They feel less confident in collaborating with parents and guardians to support student learning (2020 MSUM item M = 3.36, 2020 secondary/k-12 item M = 3.35 and 2020 elementary/early childhood M = 3.62). However, despite these differences, these means on a four-point scale indicate strong completer satisfaction in this area.
Learning Environment (TTS): Skills within the Learning Environment scale appear to be an area of strength for MSUM completers as compared to aggregated data from NExT institutions. Recent graduates have similar perceptions as supervisors related to clearly communicating expectations for appropriate student behavior (M = 3.43). Similarly, like the supervisor survey, first year teachers generally feel prepared to help students regulate their own behavior (M = 3.14).
Diverse Learners (TTS): Recent graduates perceive themselves similarly to supervisors in their abilities to effectively teach students from culturally and ethnically diverse backgrounds and communities (M = 3.40) and differentiate instruction for students with IEPs and 504s (M = 3.40).
Instructional Practice (TTS): Recent graduates indicate areas of strength within this area as: 1) effectively teaching the subject matter in the licensure area (M = 3.70) and 2) selecting instructional strategies to align with curriculum standards (M = 3.56).
Measure 5: Graduation Rates (initial & advanced levels)
Number of Initial Teacher Licensure Completers: 166
Number of Advanced Teacher Licensure Completers: 32
2019-2020 MN Administrative Licenses (85 total):
57 K-12 Principal
11 Special Education Directors
9 Superintendents
8 Community Education Directors
Average time to complete in months: Undergraduate = 39.87 months, Graduate = 24.28 months
Average credits to complete requirements: Undergraduate: 122.52, Graduate = 36.72
Measure 6: Ability of Completers to Meet Licensing (Certification) and Any Additional State Requirements; Title II (initial & advanced levels)
Pass rate data is reported based on Title II data. Title II definitions are as follows:
Pass rate = The percentage of students who passed assessment taken for an initial teaching credential in the field of preparation.
Single assessment pass rate: The percentage of students who passed the assessment among all who took the assessment.
Summary pass rate: The percentage of students who passed all tests they took for their area of specialization among those who took one or more tests in their specialization areas.
MTLE Passing Rates (Pedagogy) -
- Early Childhood (n = 15)
- Subtest 1 = 100%
- Subtest 2 = 100%
- Elementary (n = 97)
- Subtest 1 = 100%
- Subtest 2 = 100%
- Secondary (n = 24)
- Subtest 1 = 100%
- Subtest 2 = 92%
Content area first attempt passing rates range from 82% to 100%. Specific passing rates are not publicly reported due to low n’s in several content areas.
Summary pass rate for 2019-2020 completers = 77% (117/151)
Median GPA - Undergraduates
| Median GPA of individuals accepted into the program | Median (Average) – 3.53 (3.50) |
| Median GPA of individuals completing the program | Median ( Average) – 3.61 (3.58) |
Measure 7: Ability of Completers to Be Hired in Education Positions for Which They Have Prepared (initial & advanced levels)
Graduate employment rates are presented by major within each academic college
Measure 8: Student Loan Default Rates and Other Consumer Information (initial & advanced levels)
University-wide student loan default rate for 2017 cohort: 4.5%